The Texas State Mobile App was initially released in 2009 for iOS on a universal platform. It was developed in-house mostly as an exercise for the programming staff. It had no input from external stakeholders (in other words, this was all geeks, no humans). The app was updated in August 2010, again with no input from external staff. An Android version was added in 2011. In 2012 University Marketing realized we had an app and wanted in. We actually invited them in because we learned they were getting ready to fork over tens of thousands of dollars for a “custom university app” from a 3rd party. By custom, that meant it would have our school colors… Hazaa!
Marketing was brought in to the app development process which significantly spruced up the app’s visual curb appeal, but did almost nothing for the end user. Once again, the app audience was not consulted, much less considered. Only potential student were marketing to with the app’s content.
As I may have mentioned, none of these three app iterations received input from someone familiar in user experience research (UX). There was a huge disconnect between what the app creators wanted (Recruit new students!) and what the actual app users wanted (My student stuff! Where is my student stuff?!?) which left the actual app users disappointed (Typical student opinion: This app sucks…)
And as is always the case keeping the app’s content up-to-date and relevant was not planned for by Marketing. Once the app was no longer shiny, it was forgotten.
Redesign of the app began again in late 2013 by programming staff and preliminary design and navigation work was begun. Before the process was too far along it was agreed the team would apply UX principals to the latest version. In February 2014 the graphic designer and myself were able to jump in to the process and integrate some basic UX.
UX Components I managed were:
1. Analytics
Examination of the mobile app Google Analytics. I was the first to discover the iOS analytics code was broken and not recording user interaction for iPhone/iPad/iPod Touch. Data was being collected for Android only. While it was good to have some data, the majority of users (>85%) were on Apple devices. This was fixed with an update to our iOS version that went out March 19, 2014. Yea, data!
2. Expert Review
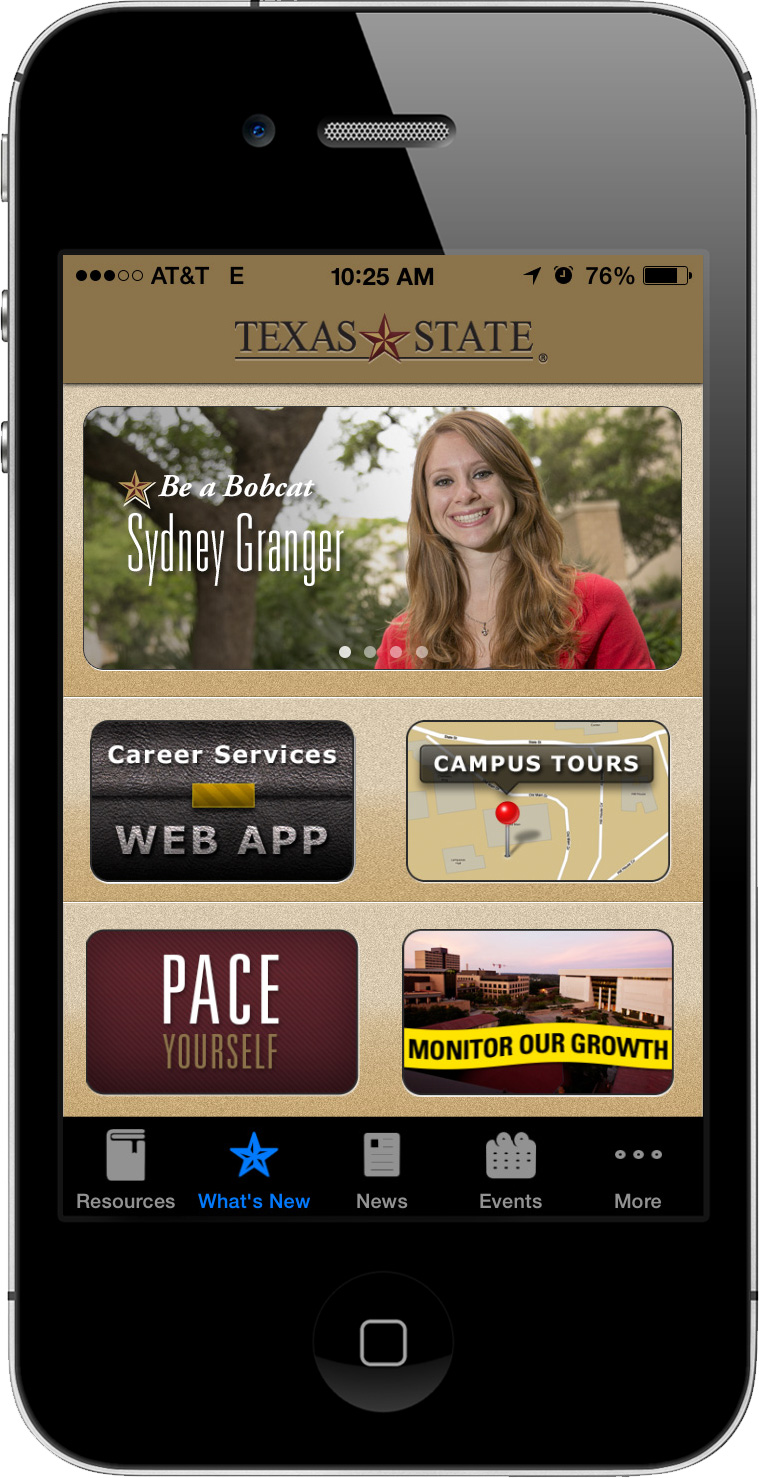
Majority of home screen content is not relevant to users. Txstate app on iPhone4s.

Main content was also off-audience. Txstate app on iPhone4s.
I conducted expert analysis review of app.
Summary: The app is mainly used by current students yet 80-90% of the content real estate on home screen in not relevant to students. Two items are Marketing (Be a Bobcat [34% of screen]; Campus Tours [11% of screen]), one is for freshman (PACE), one is construction updates with unknown audience (Monitor Our Growth), and one is for students seeking employment (Career Services).
- What’s (Not So) New – In the app’s navigational menu the above mentioned home screen items are are called “What’s New” but content does not change frequently and resulted stale content (many months old was not uncommon).
- Media (Audio, Video and Photos) – stale content.
- Resources – What students need during registration: Academic Calendar, Course Schedule, Student handbook.
- Events – Only shows today’s events. No way to see other days and no date is displayed, leaving the user to assume these are relevant and up-to-date.
- More – The Kitchen sink, and the only option on Android. Map, Directory, News, University Star, Athletics, Tram, KTSW 89.9, Dining, Library, Campus Rec, Social Media, Bobcatmail, TRACS. Not obvious you can change the menu at the bottom to your preferred components and many are just links to the websites which may or may not be mobile-friendly.
3. Internal Team Review/Card Sort
The development team gathered to look at the organization of content and I guided them in a content/card sort exercise. They were able to give feedback on current layout as they perceived it. There was strong resistance to change among some of the programming staff who learned a new phrase – “You are not your user. Let’s ask them.”
4. Student Card Sort
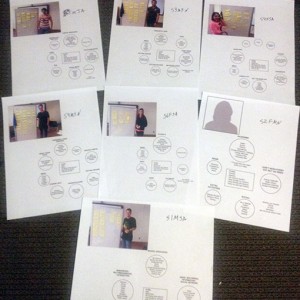
I conducted open card sort exercise in Alkek Library with students to inform the information architecture. I also gathered basic demographic data via a survey post-excercise. Data analysis was performed using SynCapsV3: Items Pairs Maps, Items x Groups, and Item Dendrogram used in analysis.
-
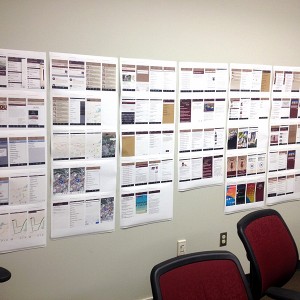
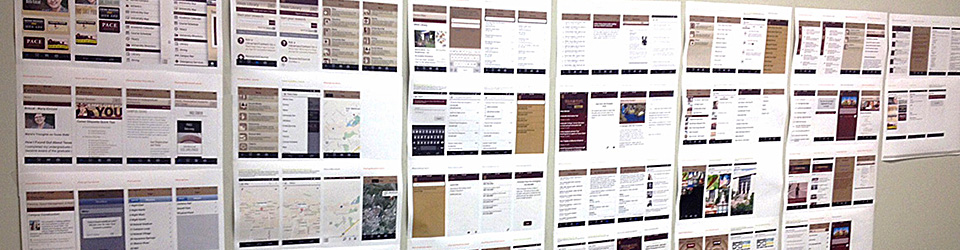
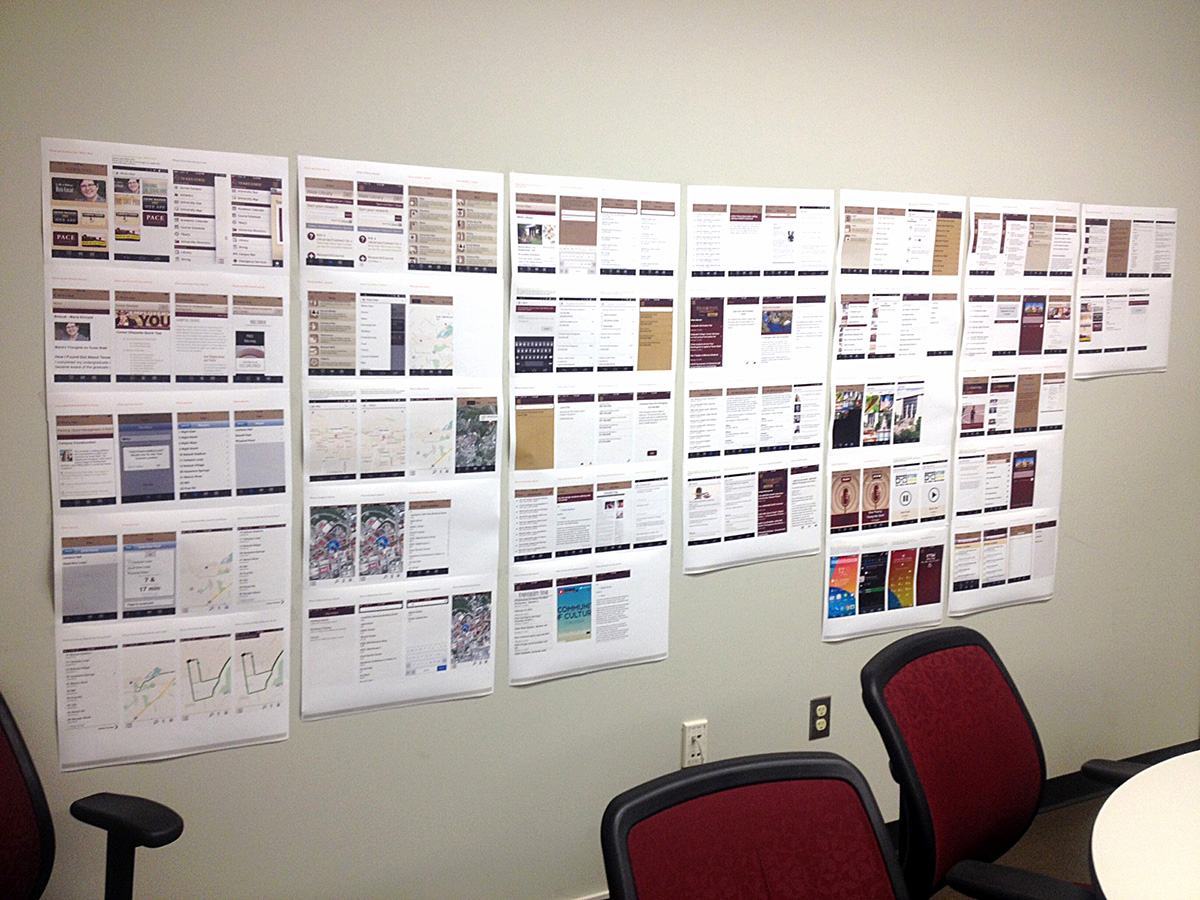
- Printed screen views of current Texas State mobile app. Try wrapping your head around that without the visual to guide you!
-
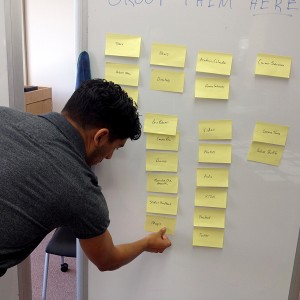
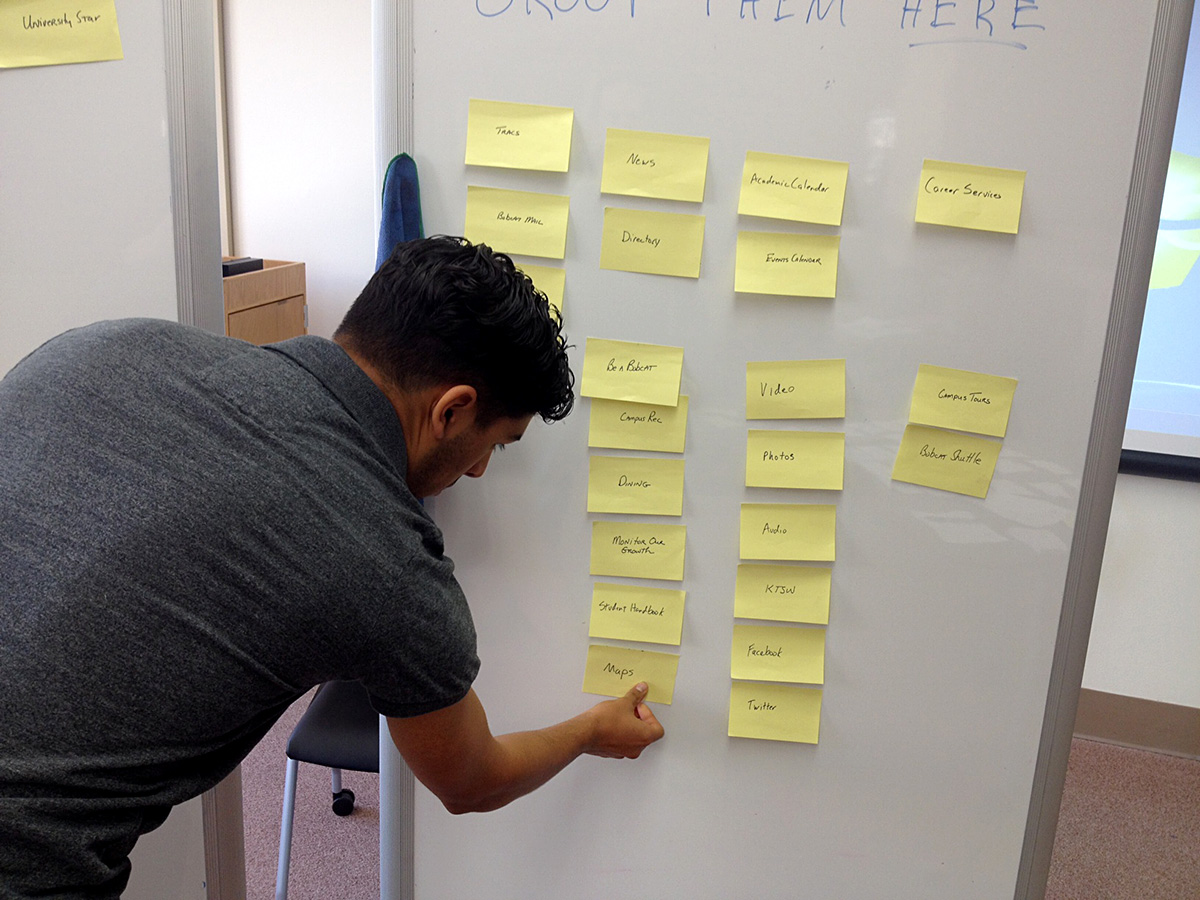
- Student card sorting mobile app content.
-
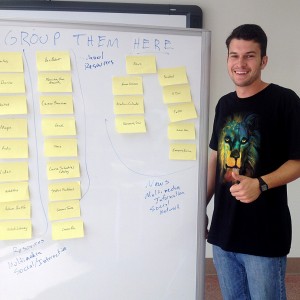
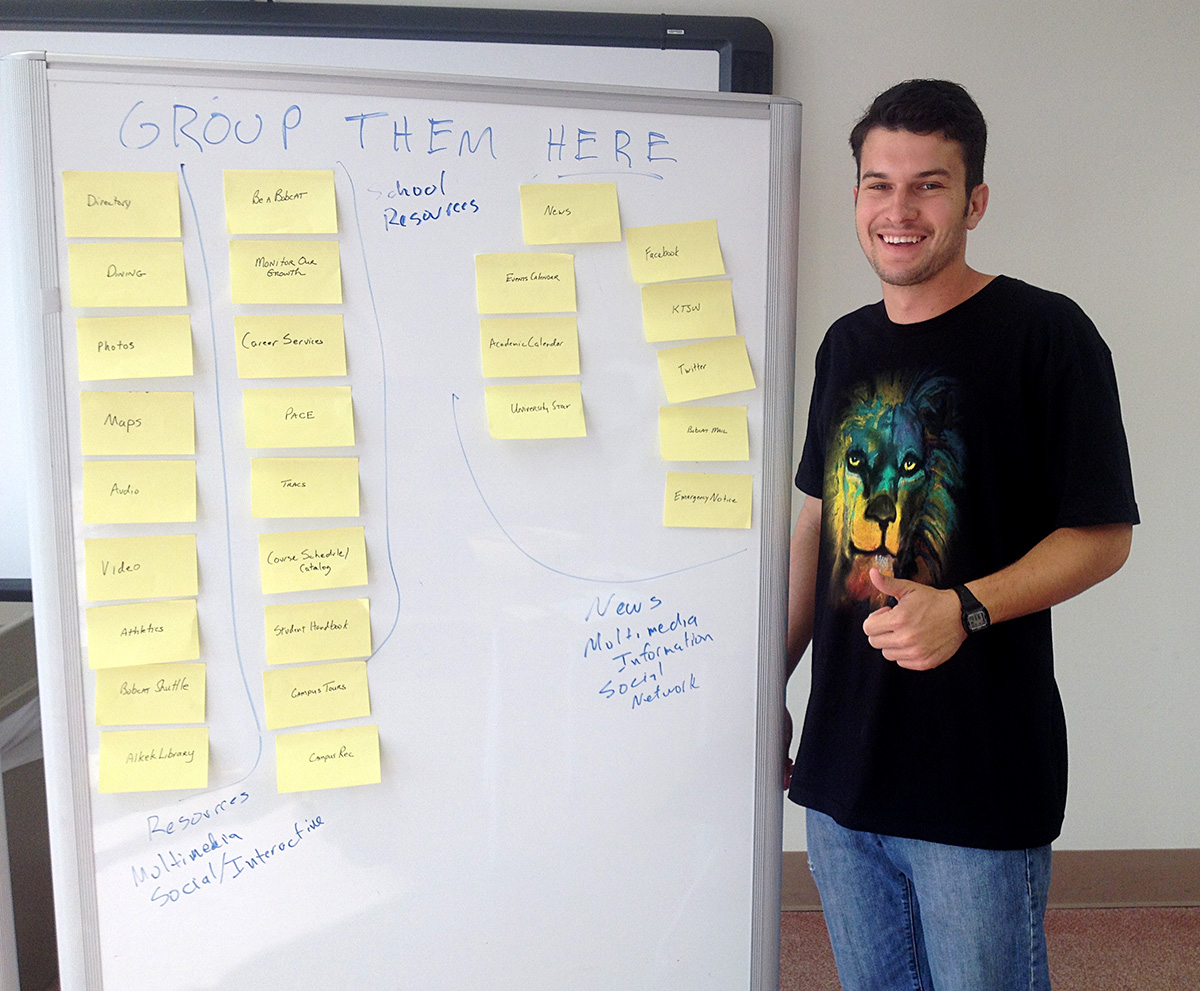
- Student posing with his card sort.
-
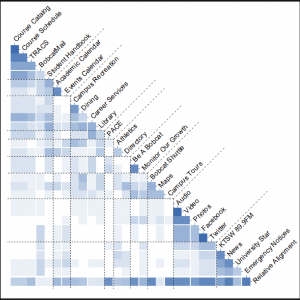
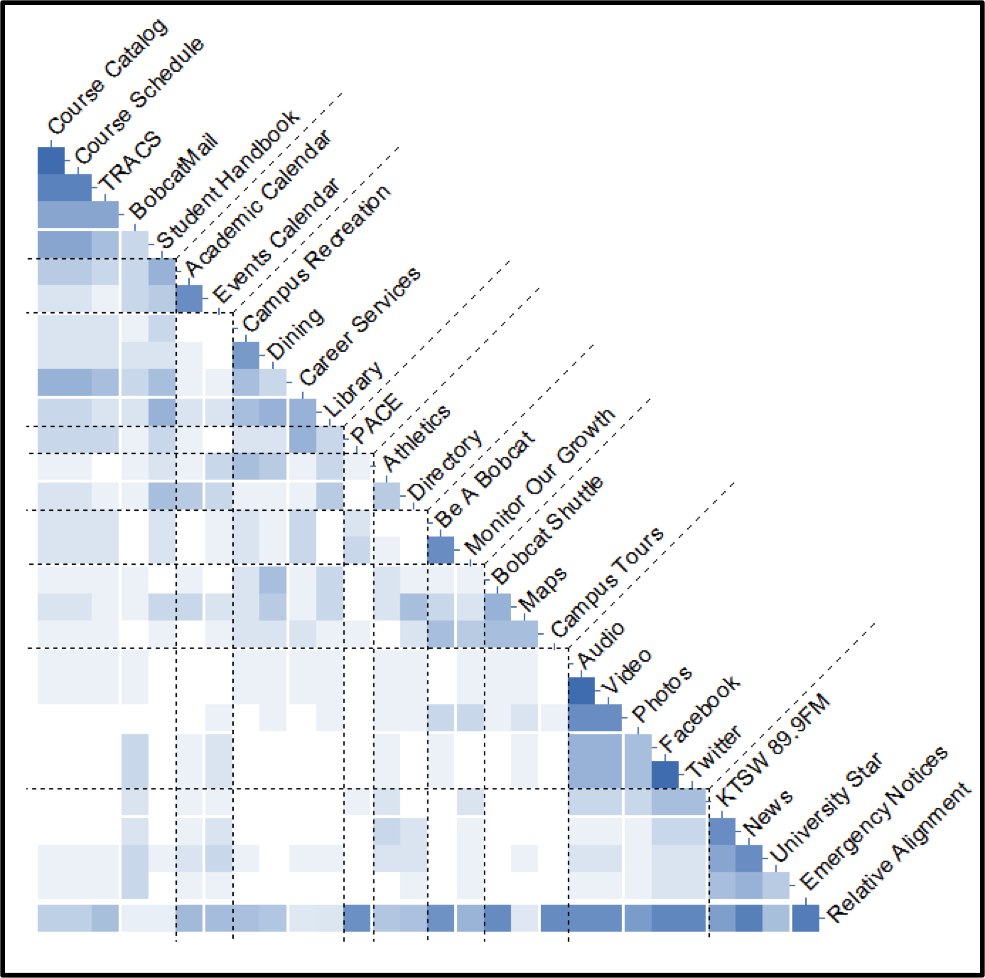
- The Items Pairs Map shows the frequency with which every possible pair of items appeared together in the same groups. Darker colors represent a higher percentage of grouping. In the above case, Facebook and Twitter were grouped 100% of the time as were course schedule and course catalog. The dashed lines represent the ideal groupings created by the card sort. Some items like PACE simply had no standard grouping. Analyzed in SynCapsV3.
-
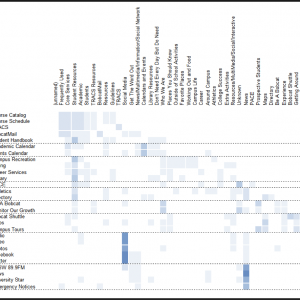
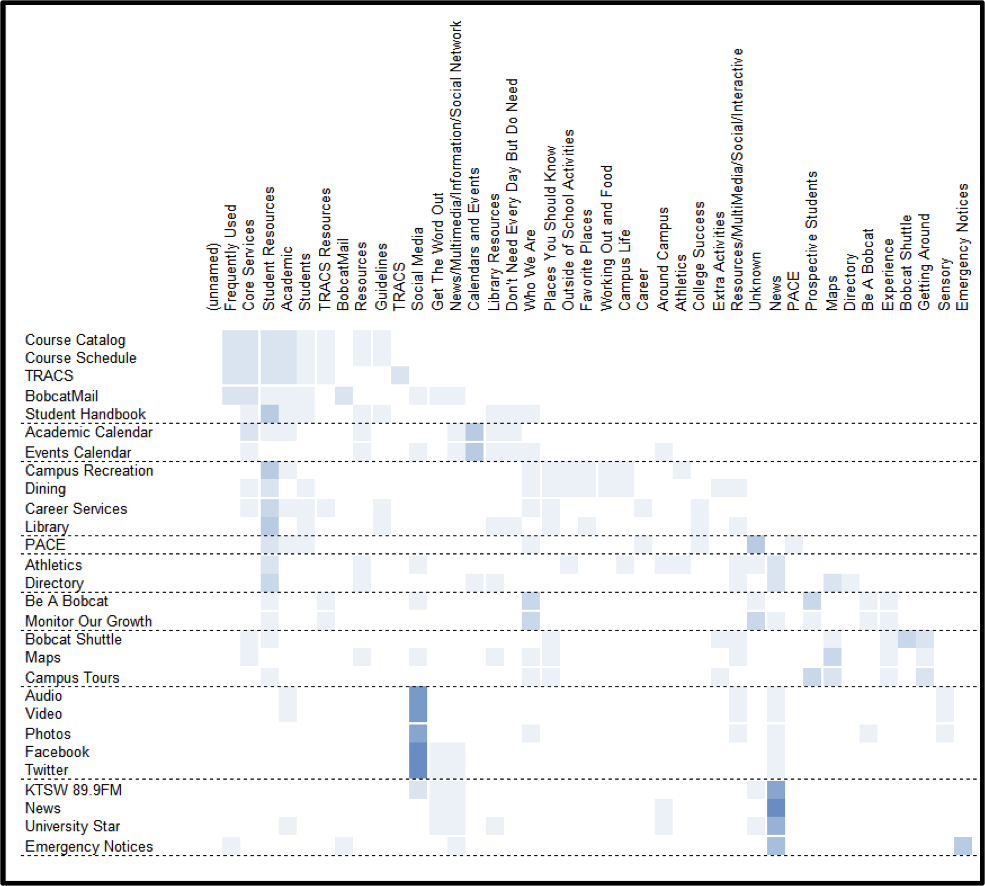
- The Items x Groups shows the common groups in which items appeared. Darker colors represent a higher percentage of grouping. Analyzed in SynCapsV3.
-
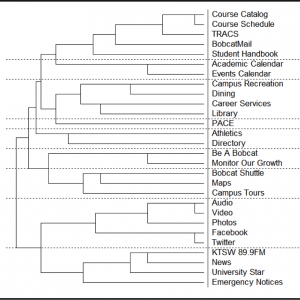
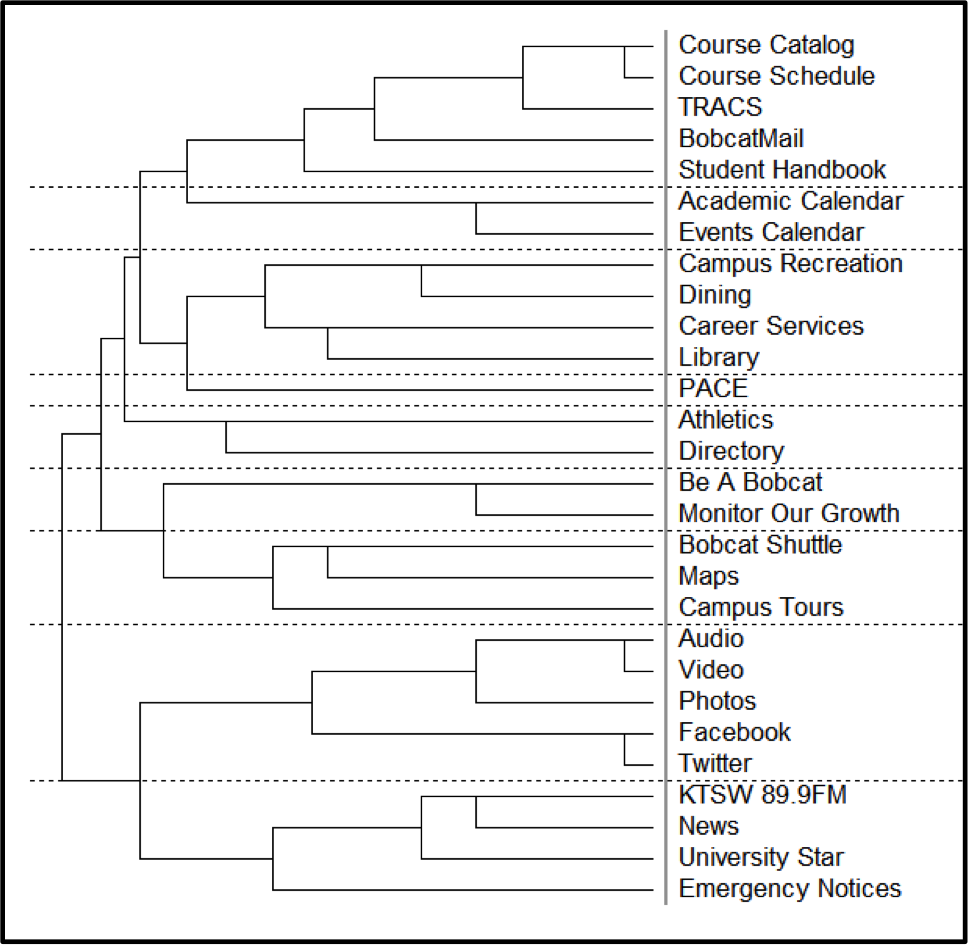
- The Item Dendrogram shows like item groups and the strength of that relationship as measured by the length of the horizontal bar connecting items. The shorter the bar, the stronger the pairing. As you can see, items are often grouped in the same group, but not with the same pairing. The card sort is meant to inform your navigational and decisions. It is only one piece of the data. Analyzed in SynCapsV3.
Card Sort Exercise Details for the Nerds – An open card sort allows participants to group information in any fashion that makes sense to them. There is no minimum or maximum number of groups, or minimum or maximum number of items in a group.
The card sort was performed on the second floor of Alkek Library in the Instant Theater space at three different sessions, each lasting an hour, March 19th and 20th. Each of the 28 items available in the app were written on sticky-notes and placed randomly on a mobile white board. Students were recruited who were studying in the area and were offered highly refined sugar (candy) to participate. Students were instructed of the purpose of the exercise and then grouped the cards on an adjacent mobile white board. After grouping the items students named their groups, completed a brief demographic survey, and took a picture with their creation if agreeable. In total twelve card sorts were performed.
The data was entered in to SynCapsV3 for analysis. Ninety-two total groups were created, resulting in sixty-one unique groups. Similar group names were then combined (e.g.: media and social media; calendar and dates; etc.) resulting in forty groups. The analysis software finds commonalities in the data, shows percent of like-group items and displays item groups with an optimum number. The number of groups can be increased or decreased depending upon your needs. SynCaps output is in the above slideshow.
5. Informal Student Interviews and Profiles
Brief student interviews conducted post-card sort show no students regularly interact with any items listed on the home screen (Be a Bobcat, Career Services, Campus Tours, PACE and Monitor Our Growth). The card sort showed students often did not know what PACE was (33%). When asked the services they used regularly they mentioned Tram schedule, TRACS LMS, Dining schedule, campus recreation schedule and Bobcatmail.
All reacted positively to being able to customize the home screen to contain useful information such as:
- A map or schedule of the nearest bus (or user selected busses)
- Common hours of operation (dining, campus recreation, library, computer labs, service centers)
- Their course schedule displaying building and room numbers.
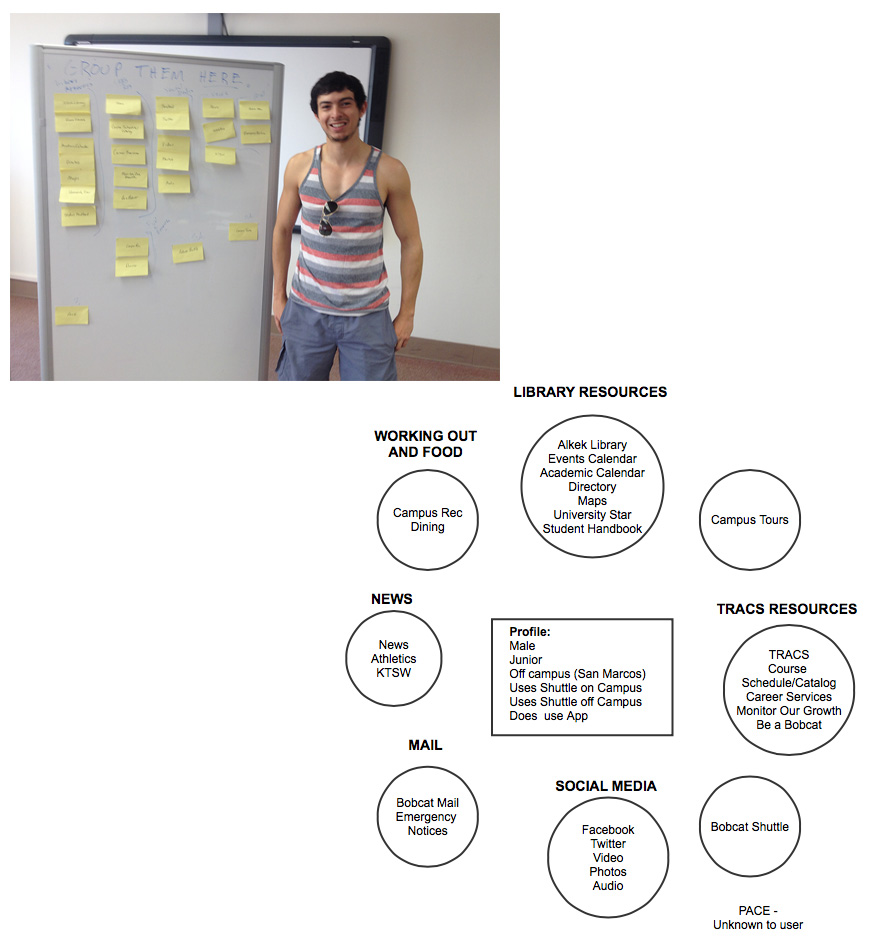
Survey data was used to create basic student profiles that were presented to team to put a face to the app users. While seemingly simple in nature, the development team had never seen the app represented as a user. Revolution!
-
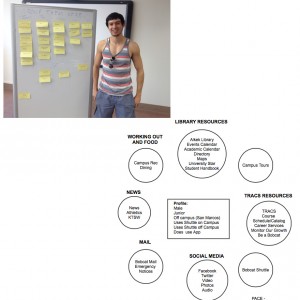
- Example Student Profile and card sort.
-
- Student Profiles and card sort.

6. Google Analytics – I used existing Android and new iOS data to analyze app usage. The data reinforced what student interviews revealed: use of TRACS LMS, Bobcatmail, Tram schedule, and course schedule.
iOS March 19-31, 2014
| 1 | TRACS | 17.6% |
| 2 | Tram | 14.5% |
| 3 | Resources | 6.6% |
| 4 | Events | 4.3% |
| 5 | Bobcat Mail Website | 3.5% |
| 6 | Bobcat Mail | 3.0% |
| 7 | What’s New | 3.0% |
| 8 | Media | 2.4% |
| 9 | Course Schedule | 2.2% |
| 10 | Select a Building | 1.7% |
Android Jan 1-Feb 15, 2014
| 1 | Tram | 14.4% |
| 2 | Course Schedule | 11.4% |
| 3 | Bobcat Mail Website | 10.3% |
| 4 | Resources | 10.1% |
| 5 | Bobcat Mail | 7.5% |
| 6 | TRACS | 6.3% |
| 7 | Map | 1.6% |
| 8 | Dining | 1.1% |
| 9 | Building List | 1.0% |
| 10 | Campus Recreation | 0.8% |
7. Red Routes
Identified critical user journeys users need to complete on the app. In the case of the Texas State app the Red Routes would be:
- Viewing the Tram schedule, find my bus.
- Viewing and interacting with BobcatMail, read my mail.
- Viewing TRACS Sites (often accessing the various TRACS Course Resources Folders)
- Viewing schedules (dining, campus recreation)
- Viewing my Course Schedule.
If these things did not work when the app was launched, it would be unsuccessful.
8. Initial Report
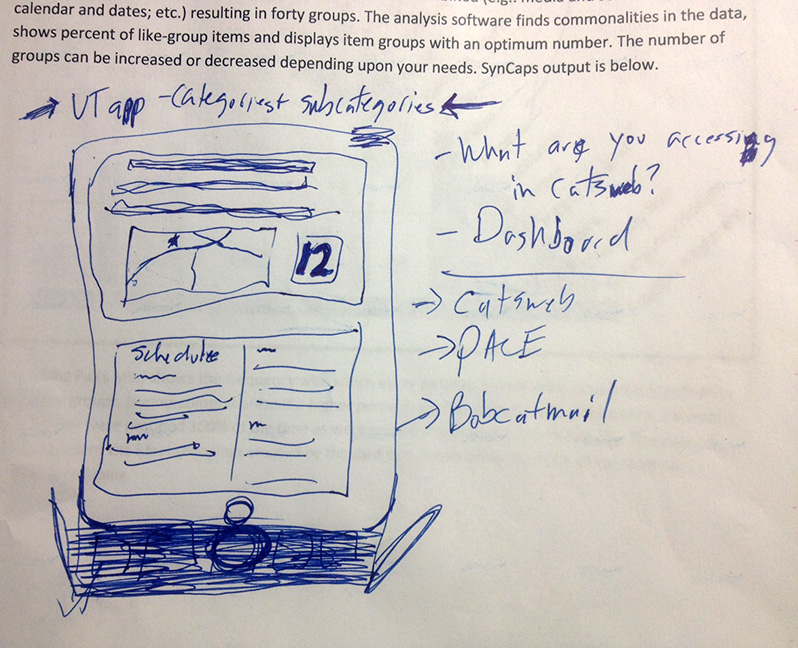
I presented an initial report to the app team combining the above activities. The report was discussed as a team as to what steps to take next. The dashboard concept, which was mentioned in several student interviews, was considered as a replacement of the current stale home screen. Based on feedback I provided some rough sketching to get across the concept of a dashboard (don’t judge me, I did say “rough”). The initial report was then to be used to create a wireframe by our graphic designer for rapid prototyping. Unfortunately, our “rapid” prototype took many, many weeks, nullifying the entire purpose of a rapid prototype. It was at this point the portions of the project stalled somewhat.
-
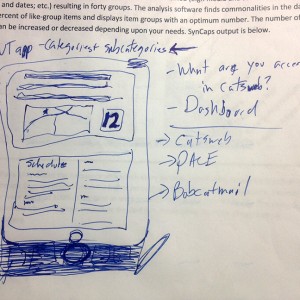
- Sketch of dashboard to replace What’s New. Contains map and bus schedule, course schedule, LMS info.
9. Bus Tracking
One significant portion of the app that did progress was the development of a real-time bus tracking feature. A new bus vendor was coming online as well as a 3rd party bus tracking data provider. The programming team worked closely with the data provider, the bus operator, the graphic designer and myself to build this new and highly desired feature. The launch of the new bus system set the deadline for the launch of the app – one week prior to classes starting in the fall 2014.
10. Additional Interviews
The programming team was very curious as to why Texas State app users viewed their email through Bobcatmail (which is a Webpage not optimized for mobile devices) via the app, instead of using their phone’s email client. The programming team felt the experience was a bad one and even have an in-app recommendation to use the phone’s email app, and not the Txstate app, to view their Texas State email. Yet, users continue to use the Bobcatmail in-app web portal.
To answer the question I interviewed students who were waiting in line at the student center at various food establishments. The answer was a separation of school and personal life. Student’s phones were personal belongings and a portal into their private, social world. School was school. They did not want to add their school email account in to their personal device. It was seen as separate. Additionally, most students already have a long-established email account at gmail or some other provider and only use their Texas State email when they have no alternative. So the web view was the preferred access method and the Texas State app gave them quick access to it.
With this knowledge the programmers decided to remove the in-app recommendation to use the phone’s email client instead.
11. Testing/QA Plan
As the app progressed to its near final form I created a comprehensive QA plan for both iOS and Android. This was the first written, comprehensive QA plan for the app in its six year existence. The plan was continually being updated as app features, functionality and content was changed. There were ever 230 documented steps, many of which had multiple content items to review. A small fleet of hardware was deployed for testing in order to discover as many bugs as possible prior to launch. Bugs were recorded in to trac for the development team to resolve and hand back for QA and closure.
-
- Just a few of the QA tickets entered in to Badger/trac for resolution.
12. Launch
Due to time and resources constraints limiting the contributions of the graphic designer the dashboard was postponed. The What’s New screen was eliminated and the home screen now opened to the condensed navigation that I recommended from the card sort exercise. While not sexy, it was highly functional, placing access to the the most relevant and used content on the screen at launch. There was also a three page/swipe tutorial upon the initial app launch to guide user to the the changes and new features.
I was responsible for writing, soliciting feedback and editing the online store description of the app and responding to user inquiries.
The Android version launched a few days prior to the iOS version as we were awaiting Apple’s approval.
13. Post-Launch
As is always the case, numerous bugs were reported by users and we quickly created a 3.0.1, 3.0.2, and 3.0.3 release over the next few weeks. Apple’s major iOS update also played a little havoc with some of our programming but it was quickly sort out.
Additionally, I approached users who reported problems with the app in their online app reviews in order to resolve any issues that went unreported. I not only identified and resolved additional bugs, but generated support from students who were impressed to see we wanted their opinions and help.
As expected the real time bus tracking proved to be the big feature, though the data provided by the bus tracking system is poor when it comes to predicting arrival times. The actual GPS data is good, at least when drivers remember to turn the system on or to switch routes.
Take-Aways
This was the first time many in the team had even seen UX put in to action. Even though it wasn’t a huge amount of UX research just these basics – interviews, card sorting, expert analysis, profiles, user testing – dramatically improved the end product. And our graphic designer decided her next hire is a UX experienced designer! Yea!
If you read this far, go download the final product. I’d love your feedback!
![]()